
In a recent Bloomberg column, former New York Fed President Bill Dudley echoes a conventional Fed narrative, contrasting Fed interest rate cycles under two supposedly distinct chairmen.
“Powell will need to find a way to persuade [markets] that he has no intention of behaving like Arthur Burns (the Fed chair who relented prematurely in the 1970s),” writes Dudley, “lest he later be forced to act like Paul Volcker—who had to correct Burns’s mistake by putting the economy through two recessions.”
In this familiar parable, Arthur Burns (Fed chairman from Jan 21, 1970 to March 8, 1978) is depicted as a timid dove who let inflation get out of hand in the 1970s by not keeping the federal funds rate high enough long enough. “America suffered a decade of inflation,” write Thomas Sargent and William Silber, “because Burns failed to do enough, soon enough and for long enough.” After the 1975 recession, “he never raised interest rates high enough to curb accelerating prices.”
By contrast, his successor Paul Volcker (Fed chairman from August 6, 1979, to Aug 11, 1987) is commonly lionized as a hero who courageously broke inflation by relentlessly keeping the federal funds rate as high as 14–19%—assiduously avoiding a hasty “pivot” to lower rates in recessions.
Chairman Jerome Powell, in his recent remarks at the Jackson Hole conference, repeated the obligatory ritual of honoring Chairman Volcker’s resolve to “keep at it until the job is done”: “The successful Volcker disinflation in the early 1980s,” said Powell, “followed multiple failed attempts to lower inflation over the previous 15 years.”
This allegorical contrast between the fearless Paul Volcker and spineless Arthur Burns has long been retold among the Fed’s hundreds of economists. It is regularly reiterated in Wall Street Journal editorials and articles, such as “For the Fed, Easing Too Soon Risks Repeat of Stop‐and‐Go 1970s.” “Stop‐and‐go” the author explained, “refers to how the Fed oscillated between raising rates to tame inflation and then backing off to shore up growth—succeeding at neither… It worsened under Fed Chairman Arthur Burns, who raised rates significantly between 1972 and 1974 but cut them the following year in the midst of a sharp recession. Inflation fell but settled at still‐elevated levels… Ultimately, it took a change in tactics by the Fed in 1981 under Chairman Paul Volcker to raise rates to far higher levels for inflation to come down and stay down.”
The implicit theory behind this story rests precariously on what Milton Friedman described as “the old fallacy of identifying tight money with high interest rates and easy money with low interest rates.” Interest rates were not extremely low from 1930 to 1933 because the Fed was pursuing an inflationary easy money policy. And Argentina and Turkey do not have higher interest rates than Switzerland and Japan because Argentina and Turkey are blessed with braver central bankers, eager to “fight inflation” with high rates for as long as it takes.
Irving Fisher (1867–1947) taught us to expect nominal interest rates to adjust to inflation, moving in the same direction eventually.
Even in Fisher’s time, low inflation and high interest rates were never seen together for long, nor were high inflation and low interest rates. Martin Uribe at Columbia University thus finds “monetary shocks that increase the nominal interest rate and inflation in the long run cause increases in interest rates, inflation, and output in the short run.” Since inflation causes higher interest rates, how can higher interest rates be considered the cure for inflation?
“Because the relation between interest rates (the price of credit) and the supply and demand for money is similarly ambiguous,” explains Scott Sumner, “the direction of rates should not be used as an indicator of expansionary or contractionary monetary policy, as lower rates could mean either.” As John Cochrane explains, “Nobody Knows How Interest Rates Affect Inflation.”
The “Fisher Effect” is one of several reasons why it is foolhardy to rely on interest rates as a target or indicator of the stance of monetary policy; Jeffrey Rogers Hummel enumerates others in an important paper questioning “Central Bank Control over Interest Rates” in the long‐run.
In addition to being conceptually ambiguous, the Fed clerisy’s strong distinction between myopic interest rate suppression under Burns versus patient rate‐hiking under Volcker also suffers the additional shortcoming of being factually untrue.
What really happened under the Burns and Volcker Federal Reserve regimes can be easily seen in three graphs.
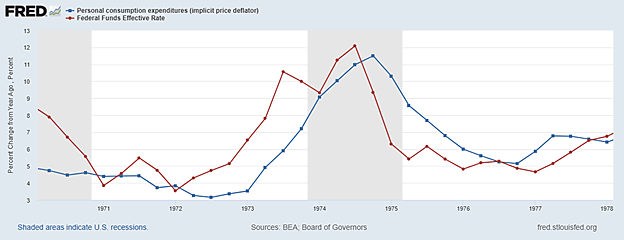
The first graph, for 1970 to 1978, confirms that the Burns Fed did indeed cut the fed funds during two recessions. But so has every other Fed regime.
“In a typical recession,” Ben Bernanke writes in 21st Century Monetary Policy, “the Fed stimulated the economy by cutting the funds rate by 5 and 6 percentage points” [page 93]. Six percentage point rate cuts turn out to be a big understatement, particularly during Volcker’s years.
During the first Volcker recession in 1980, the Fed quickly slashed the fed funds by more than ten percentage points: That rate averaged 18.8% from March 26 to April 20 in 1980 but fell to only 8.6% by early June.
The fed funds rate was quickly increased again to 19.1% when President Reagan took office in January 1981, ensuring a deep recession that began in July 1981 and ended in November 1982. Meanwhile, the fed funds rate was reduced from the 19.1% peak to 8.5% by February 1983. That was the second 10‐point rate cut from a gentleman now celebrated for never “pivoting” to lower rates when the economy implodes.
The Greenspan Fed cut the funds rate more gradually, but deeply. In the first Greenspan/Gulf War recession, the funds rate fell from 9.9% in March 1989 to 2.9% in December 1992. In the second, the funds rate fell quickly from 6.5% in November 2000 to 2.1% a year later, then continued dropping to 1% by July 2003.
The historical record of 7–10 percentage point rate cuts under Greenspan and Volcker helps to place Chairman Burns’ performance in perspective.
It is plausible that “Nixon persuaded [Burns] to keep interest rates down ahead of the 1972 election.” But the first graph makes that uncertain, were it not for the artificially low inflation numbers. If judged only by inflation statistics, the graph shows a quarterly fed funds rate of 4–5% in 1972 comfortably above year‐to‐year PCE inflation after the first quarter. But measured inflation was largely an illusion due to wage and price controls, which Burns had supported ever since his 1957 pamphlet “Prosperity Without Inflation.” His support for Nixonomics revealed Burns to be a dreadful economist, but his record as Fed chairman was typical for years with a major global oil shock (such as 1974, 1980 and 2008).
In 1973, Phase III price controls collapsed due to (1) growing shortages and (2) soaring oil prices as Arab oil producers cut production to protest Western support of Israel in the Yom Kippur War. Yet the graph nevertheless shows that the fed funds rate kept rising in step with (and slightly ahead of) the 12‐month inflation trend until the middle of the recession.
The Burns Fed was no wimpier than the Volcker Fed when it came to gratuitous abuse of temporarily super‐high interest rates in its quixotic battle with Arab oil producers. But their relatively stubborn refusal to pivot to a lower rate in the 1974–75 recession was not braver, just more reckless. For the Burns Fed to spend six months in recession before pivoting to common sense achieved nothing but senseless distress. Predictably, the fed funds rate fell more than 7 percentage points under Arthur Burns too—from 12.9% in July 1974 to 5.5% in March 1975.
“After that he never raised interest rates high enough,” according to Sargent and Silber, yet the first graph shows the funds rate was above the PCE inflation rate when Burns turned over the chairmanship to the now‐forgotten G. William Miller in March 1978.
While Miller was chairman, from March 1978 to July 1979, the fed funds rate was raised from 6.8% to 10.5%, even though year‐to‐year PCE inflation rose by only one percentage point (from 6.4% to 7.4%). By July 1979, before Volcker took charge, the fed funds rate soared to 3.2 percentage points above the 12‐month inflation (and 2 points above the 10‐year bond yield).
Fast forward to the next big oil price spike under Ben Bernanke.
A 1997 paper by Bernanke, Gertler, and Watson demonstrated that every recession since the Suez Canal Crisis of 1957 was preceded by a spike in the world price of oil and a spike in the fed funds rates. Surprisingly, when Bernanke became chairman in February 2006, and the price of West Texas crude oil (WTI) was $61.63, he too presided over continual increases in the fed funds rates as oil marched above $145 by early July 2008.
The Bernanke Fed finally stopped raising the funds rate and left it at 5.25% from July 2006 to July 2007 before reducing it by one percentage point when the Great Recession started that December. That was ahead of the recession curve but behind the yield curve, which kept flashing a red warning sign of recession. Well after the Great Recession was obviously severe, the funds rate was still 2% from May to August 2008. It did not start falling sharply (to 0.15%) until the price of WTI crude fell from $133 in July 2008 to $44 in December. Like his predecessors, though, Bernanke too cut the funds rate by 5 percentage points eventually. Unlike them, he vastly expanded bank reserves by buying Treasury debt (QE), paid banks interest for holding those reserves, and offered “forward guidance” promising the funds rate would be kept near zero.
Comparing the rate‐cutting record of Arthur Burns to that of Volcker, Greenspan, and Bernanke, it is obvious dishonesty to claim Burns merits special condemnation for cutting the fed funds rates after the FOMC inverted the yield curve and launched another recession. Every Fed Chairman since Burns raised rates until the recession was painful, then cut rates 5–10 percentage points.
The second graph repeats the first, except that the years describe the Volcker Fed. The blue line shows PCE inflation, and the red the fund rates.
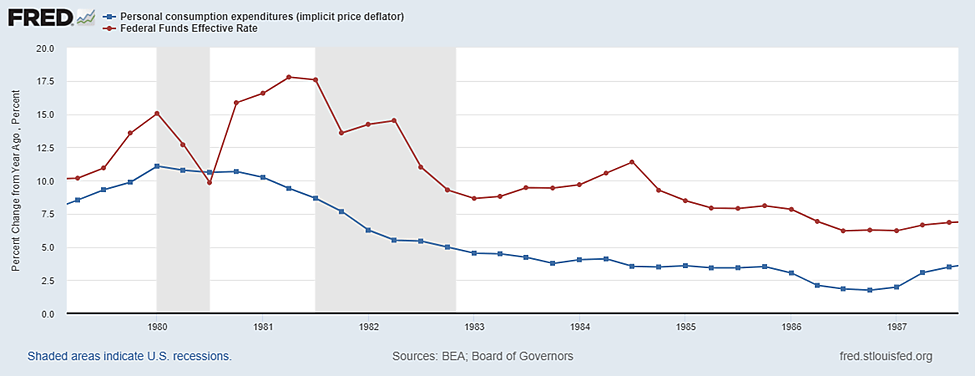
Paul Volcker had the misfortune of being Fed Chairman during the second of the three biggest oil price shocks so far. Burns had the same rotten luck in 1973–73 and Bernanke in 2007-08. Since oil price spikes always inflate consumer inflation, even core measures, the Fed always tried to fight higher world oil prices with higher domestic interest rates. Each effort involved first pushing the federal funds rate unusually high, then unusually low.
The last graph depicts the Burns and Volcker eras—as nearly identical improper overreactions to two major oil shocks. The reduction in world oil supply during the Arab‐Israeli War pushed crude oil prices up 184% by February 1974, compared with a year before, so the Burns Fed put the fed funds rate above 12%. The higher cost of energy and credit pushed the economy into recession, so the fed funds rate was quickly reduced.
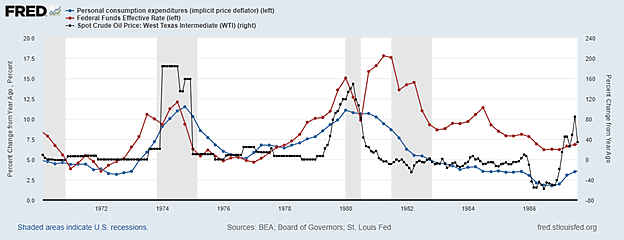
The Iranian Revolution again pushed crude oil up 149% by April 1980, so the Volcker Fed put the fed funds rate above 15%. The higher cost of energy pushed the economy into recession, so the fed funds rate was reduced more deeply and quickly than ever before or since. In the Fed’s cherished Burns‐Volcker allegory, the astonishing cut in the funds rate in 1980 is invariably described as “what happened in the ’70s”—under Burns or Miller—rather than what happened in 1980. Such stylized facts safeguard the folklore.
The price of a barrel of WTI crude oil rose from $14.85 in January 1979 to $39.50 in April 1980 but was back down to $11.58 by July 1986. What “forced” the Volcker Fed to raise the funds rate to 19% twice (before cutting it by 10 points in the twin recession) was a global oil price spike—like 1973–74 under Burns, 1990–91 under Greenspan, and 2007-09 under Bernanke.
The black line shows the monthly year‐to‐year changes in the price of WTI crude. The blue line shows the quarterly year‐to‐year PCE inflation, which rose and fell with oil prices. The red line shows the quarterly fed funds rate, which also tended to rise and fall with oil prices (though belatedly in 1982).
PCE inflation slowed in 1980, even as the funds rate was being cut ten percentage points, and inflation continued to slow in 1981 as the fed funds rate was briefly raised to 19% before being cut another ten points. The funds rate rose again from about 8% to 14% in 1983–84, even though core and all‐items PCE inflation was 4% or less after mid‐1983. The main reason for slowing PCI and CPI inflation after the 1980 oil shock was clearly the end of the Iranian Revolution and the subsequent Iran‐Iraq War.
Oil fell from $35–40 between April 1980 to April 1981 to below $30 in 1983–84, to under $20 from 1986 to 1989. Paul Volcker’s famous victory over inflation in 1983–86 mainly consisted of a deep drop in the price of oil—thanks to peace in Iran and Iraq (until the 1990–91 Gulf War).
To sum it up, Burns was not an inferior Fed chairman because he cut interest rates sharply in two recessions for the obvious reason that Volcker cut interest rates even more in two other recessions, as did all other Fed Chairmen before and since.
Neither Burns nor Volcker seemed to realize how little a central could do to bring inflation down until the global price of oil stopped rising, then fell. High domestic interest rates might lower worldwide oil prices by contributing to a worldwide recession, but cyclically depressed prices from a global “going out of business sale” are temporary. The rising dollar under Volcker probably helped keep oil prices cheaper in the dollar than in other currencies, but that doesn’t help explain why inflation also came down when oil prices did during the Burns and Greenspan years when the dollar was weak.
What primarily allowed us to avoid major oil price spikes and related global inflation from mid‐1983 to 2006, and again from 2010 to 2019, had essentially nothing to do with who happened to be Fed chair, and everything to do with the absence of wars and revolutions in oil‐producing countries (such as Russia).
If Federal Reserve historians must single out specific chairmen for special recognition, many of them have earned credit for 13 hard landings.