

New US state-to-state migration flow data for 2019 was released today by the Census Bureau and this is an update of my annual analysis that attempts to answer the question: What significant differences are there between America’s top ten inbound and top ten outbound states when they are compared on a variety of measures of business climate, individual and corporate tax burdens, state fiscal health, electricity and housing costs, economic performance, and labor market dynamism?
To determine the top ten inbound and outbound states based on state-to-state migration patterns displayed in the table above (click to enlarge), I ranked each US state by the percentage of inbound vs. outbound moves in 2019 using the Census Bureau data in this Excel file. For example, for the state of New York, there were a total of 694,514 moves in 2019 — 439,708 outbound moves (63.3% of the total) and 254,806 inbound moves (36.7% of the total), for a -26.2% net outflow percentage, making New York the No. 1 outbound US state last year (same as 2018). For Arizona, there were 426,926 moves, and 59.3% were inbound (253,295) and 40.7% (173,631) were outbound for a +18.7% net inflow, making Arizona the No. 1 inbound US state in 2019 (same as 2018). The top ten inbound and top ten outbound states are ranked across the first row of each group above — Arizona No. 1 inbound state to Oklahoma No. 10, and New York No. 1 outbound state to No. 10 Michigan. In total, there was a net outflow of more than 700,000 Americans from the top ten outbound states last year, and a net inflow of nearly 600,000 Americans moving into the top ten inbound states above.
(Note: I ignored small states when total moves — outbound + inbound — were less than 100,000.)
Q: Based on 2019 state migration Census Bureau data, what significant differences are there between the top ten inbound and top ten outbound states when they are compared on a variety of measures of business climate, business and individual taxes, fiscal health, electricity and housing costs, economic performance, and labor market dynamism? Assuming that many Americans and US companies “move/vote with their feet” when they relocate from one state to another, is there any empirical evidence to suggest that Americans are moving to states that are relatively more economically vibrant, dynamic, and business-friendly, with lower tax and regulatory burdens, lower energy and housing costs, with more economic and job opportunities, from states that are relatively more economically stagnant with higher taxes and more regulations, higher energy and housing costs, and with fewer economic and job opportunities?
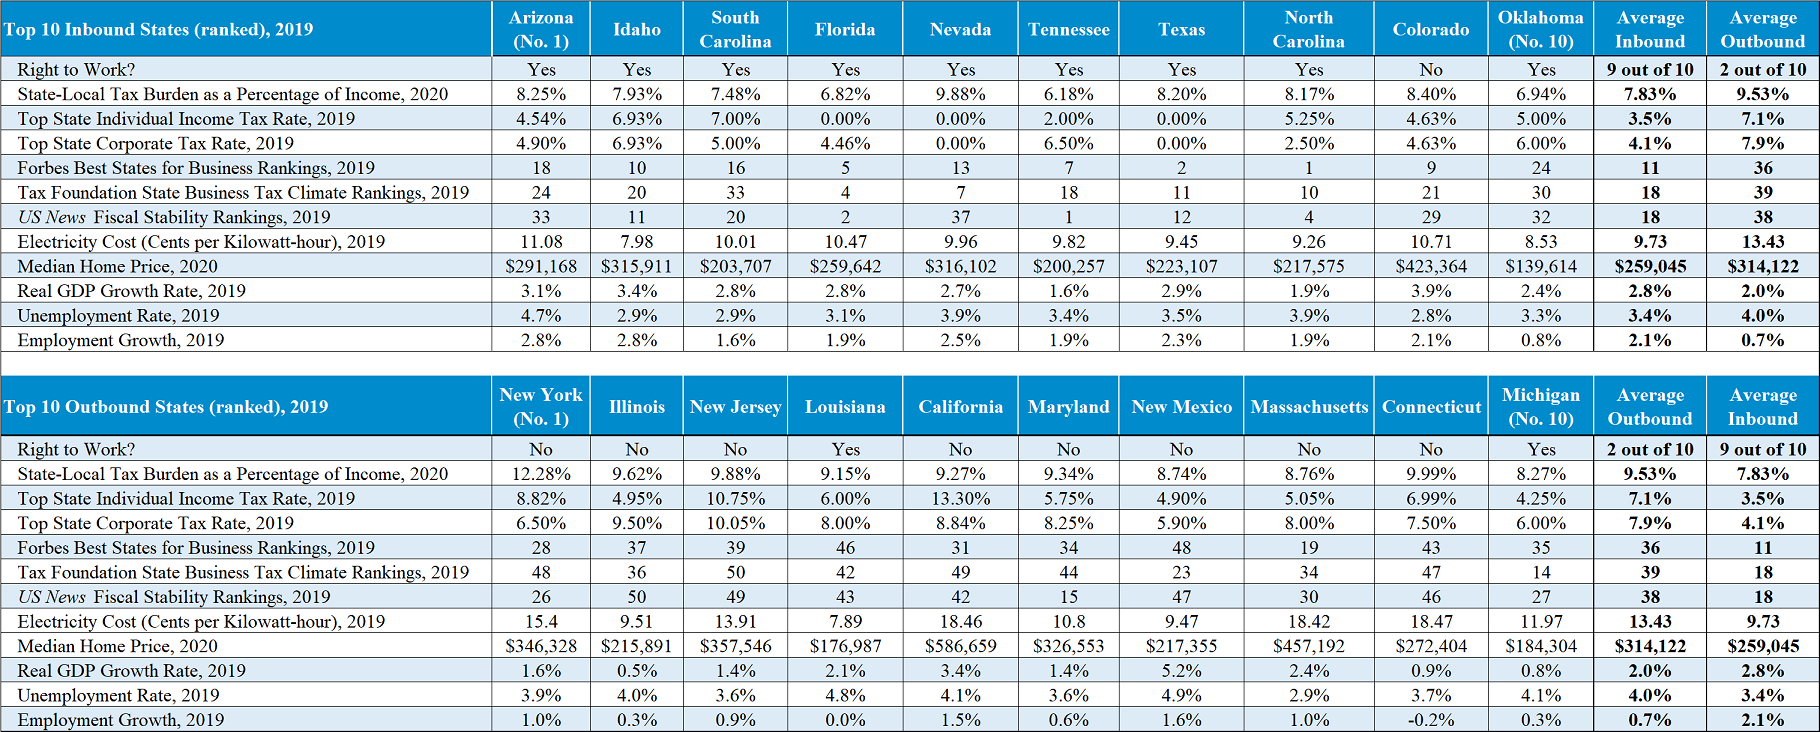
The table above (click to enlarge) summarizes a comparison between the two groups of US states (top ten inbound and top ten outbound) on 12 different measures of economic performance, labor market dynamism, business climate, electricity and housing costs, tax climate, and fiscal stability for those ten states. And on each of those 12 measures, there is empirical evidence that the top ten inbound states are on average out-performing the top ten outbound states, suggesting that migration patterns in the US do reflect Americans and firms “voting/moving with their feet” from high-tax, business-unfriendly, fiscally unhealthy, economically stagnant states with relatively high electricity and housing costs to lower-tax, more business-friendly, fiscally healthy and economically vibrant states with lower electricity and housing costs. Let’s review those 12 measures, one at a time:
1. Right-to-Work. Nine of the top ten inbound US states in 2019 were Right-to-Work (RTW) states (all except Colorado), while eight of the top ten outbound states are forced-unionism states (all except Louisiana and Michigan). According to many studies like this one by my AEI colleague Jeff Eisenach (emphasis mine):
There is a large body of rigorous economic research on the effects of
RTW laws on economic performance. Overall, that research suggests that RTW laws have a positive impact on economic growth, employment, investment, and innovation, both directly and indirectly.
Therefore, it would make sense that American businesses and workers are leaving low-growth, forced-unionism states for higher-growth, RTW states with more dynamic labor markets and greater job opportunities.
2. State Tax Burden. Earlier this year, Wallet Hub released a study on the “Overall Tax Burden by State” that measured the percentage of each state’s total personal income that goes to state and local taxes in the form of a) individual income taxes, b) property taxes, and c) sales and excise taxes. The average state tax burden for the top ten inbound states was estimated to be 7.8% compared to a 9.5% average tax burden for the top ten outbound states. Seven of the 14 US states with the highest total state tax burdens (New York, Connecticut, New Jersey, Illinois, California, Louisiana, and Maryland) were in the ten highest outbound states in 2019.
3. Income Taxes. a) According to the Tax Foundation, the average top individual income tax rate in the top ten inbound states was 3.5% in 2019 compared to an average top tax rate of more than twice (7.1%) in the top 10 outbound states. Three of the top 10 inbound states — Florida, Nevada, and Texas — have no state individual income tax.
b) Similarly, the average top corporate tax rate based on Tax Foundation data in the top ten inbound states was 4.1% last year compared to 7.9% in the top ten outbound states. Two of the top inbound states — Nevada and Texas — have no state corporate income tax. It’s an ironclad law of economics that if you tax something you get less of it, and it’s therefore, no surprise that Americans and businesses are leaving relatively high tax states for relatively low tax states.
4. Forbes Best States for Business. Based on its most recent annual state ranking that measures six business categories: business costs, labor supply, regulatory environment, current economic climate, growth prospects, and quality of life, Forbes rated North Carolina, the No. 8 inbound state in 2019, again as the best US state for business last year. Five of the other US states in the top ten inbound states (Texas, Florida, Tennessee, Colorado, and Idaho) ranked in the top ten best US states for business according to Forbes, and all of the top ten inbound US states in 2019 ranked in the top half of Forbes’ best states for business. The average Forbes ranking for the top ten inbound states last year was 11 out of 50 compared to the average ranking of 36 out of 50 for the top ten outbound states. For the category “Business Cost” in the Forbes study five of the top inbound US states — Texas, North Carolina, Nevada, Oklahoma, and Tennessee — ranked in the Forbes’ top ten for that category. Not surprisingly, four of the top outbound states in 2019 – New Jersey, Massachusetts, California, and Connecticut — were among the five US states with the highest business costs according to Forbes.
5. Business Tax Climate Rankings. Every year The Tax Foundation calculates and reports its State Business Tax Climate Index based on each US state’s corporate income taxes, individual income taxes, sales taxes, property taxes, and unemployment insurance taxes. In the most recent Tax Foundation rankings, four of the top ten outbound states (New York, New Jersey, Connecticut, and California) were the four US states with the worst business tax climate. For the top ten inbound states, eight states were in the top half of states for the best (lowest) tax climate. The average business tax climate ranking for the top ten inbound states was 18 (top half) compared to an average ranking of 39 (bottom one-quarter) for the top ten outbound states.
6. State Fiscal Stability Rankings. US News and World Report recently ranked US states by “fiscal stability” based on both on a short-term and long-term basis. State credit ratings and public pension liabilities measure long-term financial health, while asset liquidity and a state’s budget management (spending vs. revenue) are used to measure short-term health. According to the report, “The fiscal stability of a state’s government is vital to ensuring the success of government-sponsored programs and projects and the quality of life of the state’s residents.”
Tennessee (No. 6 inbound state) is currently ranked as the top US state for fiscal stability and it’s followed by other states among the top ten 2019 inbound states including Florida (No. 2 for fiscal stability) and North Carolina (No. 4). Four of the top ten outbound states were among the five states with the worst fiscal stability rankings – Illinois (No. 50 for fiscal stability), New Jersey (No. 49), New Mexico (No. 47), and Connecticut (No. 46).
7. Average Electricity Cost by state was added last year as another factor that might contribute to businesses and households moving from states with relatively high energy costs to states with lower energy costs. According to data from the Energy Information Administration on the “Average Price of Electricity to Ultimate Customers,” the average price of electricity for all sectors (residential, commercial, industrial, and transportation) was 9.73 cents per kilowatt-hour in the top ten inbound states last year. For the top ten outbound states, the average cost of electricity in 2019 was 13.43 cents per kilowatt-hour, which is nearly 38% higher than the top ten inbound states. The three US states with the highest electricity costs (except for Alaska and Hawaii) are Connecticut, California, and Massachusetts, and those three states were among the top ten outbound states last year. Because electricity costs affect both the cost of living for households and the cost of operation for businesses, it’s not surprising that the states with the highest electricity costs are losing population to states with lower energy costs.
8. Median Home Price by state is another new measure added to the analysis last year that could affect US migration patterns, and it does appear that Americans are leaving states with high housings costs to move to states with lower median home prices. The median home prices by state in the table above are from Zillow and show for the top ten inbound states, the average of the median home prices for those states is $231,250 compared to $314,122 for the top ten outbound states. The median home in the top ten outbound states is $83,000 (and 36%) greater on average than for the top ten inbound states, which could partly explain the outbound migration from states with high housing costs to states with lower housing costs. Based on a 10% down payment and a 4% 30-year fixed-rate mortgage, annual housing costs in the top ten inbound state would be about $3,000 lower than the top ten outbound states.
9. Economic Performance. The last three categories above show economic performance measures for each of the 20 states for (a) state real GDP growth rate in 2019, b) the average state jobless rate in 2019, and c) the annual employment growth in 2019. For the top ten inbound states, the average real GDP growth rate last year was 2.8%, the average jobless rate was 3.4% (below the national average of 3.7%), and the average annual job growth was 2.1%. In contrast, the average figures for the ten outbound states were 2.0% for real GDP growth, 4.0% for the jobless rate (above the 3.7% national average), and 0.7% for annual job growth. In other words, compared to the top outbound states, output growth was higher by almost a full percentage point in the top inbound states last year (2.8% vs. 2.0%), the average jobless rate was more than one-half percentage point lower (3.4% vs. 4.0%) and annual employment growth was three times higher (2.1% vs. 0.7%).
Those three important economic indicators suggest that the top ten inbound states are stronger economically on average than the top ten outbound states with faster economic growth, and more robust labor markets with lower jobless rates and greater rates of job creation.
Bottom Line: Based on detailed state-to-state migration data in 2019 from the Census Bureau, the migration patterns of US households (and businesses) followed predictable patterns, reflecting differences among states in economic growth, tax burdens, business climate, energy and housing costs, labor market robustness, and fiscal stability. To answer the questions posed above, there are significant differences between the top ten inbound and top ten outbound states when they are compared on a variety of 12 measures of economic performance, business climate, tax burdens for businesses and individuals, fiscal stability, electricity and housing costs, and labor market dynamism. There is empirical evidence that Americans and businesses “vote with their feet” when they relocate from one state to another, and the evidence suggests that Americans are moving from states that are more economically stagnant, fiscally unhealthy states with higher tax burdens and unfriendly business climates with higher energy and housing costs and fewer economic and job opportunities, to fiscally sound states that are more economically vibrant, dynamic and business-friendly, with lower tax and regulatory burdens, lower energy, and housing costs and more economic and job opportunities.
Related: See recent Wall Street Journal op-ed by “California, Love It and Leave It” by venture capitalist Joe Lonsdale who writes about why he moved his company from one of the top ten outbound states above (California) to one of the top ten inbound states (Texas):
I love California, but I had to leave. I grew up in Fremont, attended Stanford, and have spent most of my adult life in the San Francisco Bay Area, founding technology companies like Palantir and Addepar and investing in many others. In 2011 I founded 8VC, a venture-capital firm that today manages more than $3.6 billion in committed capital. Few top venture capitalists consider living anywhere other than California and a handful of global financial centers, but I am moving myself and dozens of my 8VC colleagues to a new land of opportunity: Texas.
The harsh truth is that California has fallen into disrepair. Bad policies discourage business and innovation, stifle opportunity and make life in major cities ugly and unpleasant.
Related: The chart below shows one-way U-Haul rates for a 26-foot truck at the end of November. The significant differences in prices to rent a U-Haul truck for the same distance between matching cities below reflects (a) the high demand for trucks leaving California to destinations like Arizona and Texas and (b) the much lower demand for trucks going to California from Arizona and Texas. When you’ve got a lot of trucks leaving California and not very many coming back, it makes economic sense for U-Haul to price one-way truck rentals accordingly. It’s expensive to rent a truck to leave California because of the out-migration and cheap to rent a truck going to California due to low demand. The price differences as great at 8-to-1 in the table below reflect the migration patterns discussed above.

The post Top 10 inbound vs. top 10 outbound US states in 2019: How do they compare on a variety of measures? appeared first on American Enterprise Institute – AEI.