
1. Chart of the Day I (above) is a new animated bar chart race showing the shares of energy sources used to generate the nation’s electricity from 1949 to 2020. Here are a few observations:
- Coal was the No. 1 fuel source for electricity in every year until 2016 when natural gas became the No. 1 fuel source.
- In every year from 1949 to 2011 coal supplied at least 40% of the nation’s electric power and in most years (43) supplied more than 50%.
- In every year from 1983 and 2008, nuclear supplied more electric power than natural gas, and in 2020 it generated more electricity than coal.
- Natural gas has become so abundant and cheap that it now supplies more electric power (41.2% this year) than coal and nuclear combined (38.3%).
================================================================

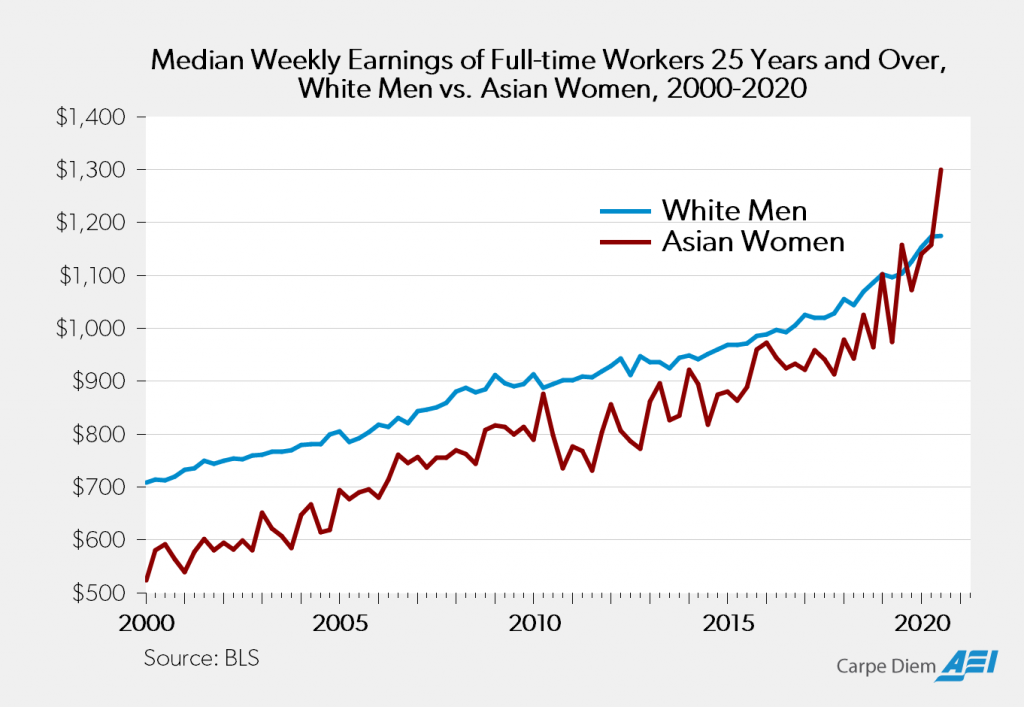
2. Chart of the Day II (above) shows a “narrative-destabilizing development” that my AEI colleague Christina Sommers recently discovered. For workers ages 25 and over, the median weekly earnings for Asian women in the third quarter of 2020 ($1,300) almost 11% more than white men ($1,174) according to the most recent data from the BLS. Stated differently, white men earned only 90.3 cents for every dollar earned by Asian women during the July-September quarter this year. What’s going on here? Female privilege? Asian privilege? Labor market discrimination against white males?
================================================================

3. Chart of the Day III (above) displays another “narrative-destabilizing fact” based on Department of Education data for 2018 (most recent year) that was also discovered by Christina Sommers. The shares of 18-24-year-old white women (45.4%), black women (40.9%) and Hispanic women (40.4%) enrolled in college in 2018 (most recent year) were ALL higher than the share of white men in that age group (39.1%) enrolled in college. Female privilege? Black/Hispanic privilege?
================================================================

4. Chart of the Day IV (above) is another “narrative-destabilizing and inconvenient fact.” Last year, the USA had the single-largest reduction in CO2 of any country in the world, thanks largely to the fracking revolution in America that has led to a major substitution of natural gas for coal to generate the nation’s electricity (see animated chart above). So at the same time that Joe Biden and other Democrats want lower CO2 emissions to avoid the “existential threat” of climate change, they want to kill the very technology – fracking — that helped lower America’s C02 to the lowest level last year in more than a quarter-century.
================================================================

5. Chart of the Day V (above) shows that C02 in the US for the first half of the year was the lowest this year in 37 years, since 1983. For that “greening” of America you can thank fracking, a technological marvel that allowed us to access oceans of shale gas in Pennsylvania, Texas, Louisiana and Oklahoma. As clean, abundant and cheap natural gas replaced coal to generate the nation’s electricity, CO2 emissions have declined to levels not seen since President Reagan’s first term!
================================================================

6. Chart of the Day VI (above) displays another “narrative-destabilizing trend” — the frequency of strong to violent tornadoes (F3+) in the US has been decreasing over time and not increasing. In the 9 last years, the annual tornado count in the US has been below the long-term average of 44 strong/violent tornadoes per year. The two years with the lowest number of tornadoes since 1954 happened very recently in 2017 (15) and 2018 (12).
================================================================

7. Chart of the Day VII (above) shows another “narrative-destabilizing fact” that helps put the risk of COVID into perspective. As Don Boudreaux commented about these data:
It makes plain that the risk that this disease poses to humanity as a whole does not differ categorically from the risk of seasonal flu – or, for that matter, from any of the many other perils that we humans routinely encounter. And because these figures show the estimated chances of survival of those who are infected with Covid, even for persons 70 years of age or older Covid obviously is not a categorically unique threat.
================================================================

8. Chart of the Day VIII (above) shows the significant and fascinating differences in attitudes and behaviors towards COVID by party and gender according to a recent Gallup poll. See any patterns?
================================================================

9. Chart/Venn Diagram of the Day IX (above). Aren’t the pretentious “All Are Welcome Here Signs” the epitome and apotheosis of “virtue signaling” by the “wokerati.” I suspect they are also wildly inaccurate because of the highly selective nature of the “welcome”? For example, would a pro-life Trump supporter with a MAGA hat and an NRA shirt be welcomed in for a cup of coffee? Would everybody (“all”) be welcome to stop by and use the bathroom? Or sleep over? Not likely. I think an accurate interpretation of the sign would be “All Are Welcome Here As Long As Your Agree with My Leftist Ideas – Everybody Else Can Go to Hell.” My friend Mike Saltsman says that his favorite substitute would be a message that “In this house, we believe that simplistic platitudes are poor substitutes for respectful and rational discussions about complex ideas.”
================================================================

10. Chart of the Day X (above) shows graphically the collapse of Venezuela’s oil industry (and economy) thanks to the corrosive effects of socialism despite sitting on the world’s largest oil reserves. However, a recent New York Times article “Venezuela, Once an Oil Giant, Reaches the End of an Era” never once mentioned the word “socialism” in its analyis of the collapse of oil production in Venezuela?
The post Monday evening links, all chart edition appeared first on American Enterprise Institute – AEI.