

In 2015, countries around the world met in Paris at the 21st Conference of Parties to the U.N Framework Convention on Climate Change (UNFCCC) where they agreed to limit global temperature increases well below 2 degrees Celsius by 2100. We now have 8 years of data on global emissions following the “landmark” Paris Agreement.
Today, I evaluate the effects of the Paris Agreement on decarbonization by comparing rates of decarbonization for the 8 years before the Paris Agreement to the 8 years following — for the top 20 emitting countries and the world overall. This evaluation seeks to identify an acceleration of decarbonization rates (that is, a reduction in the ratio of carbon dioxide emissions to GDP)(1). Such acceleration is necessary if the world is to achieve ambitious targets for global emissions consistent with the temperature targets of the Paris Agreement.
Let’s start with a topline number — 8.1%.
That is the annual rate of decarbonization necessary globally to achieve an 80% reduction in global carbon dioxide emissions by 2050, assuming an annual global GDP growth rate of 2.5%.(2)
Let’s next look at the pre- and post-Paris rates of decarbonization for the world and the top 20 carbon dioxide emitters of 2023, which together represent about 81% of 2023 global emissions. The table below ranks countries by post-Paris decarbonization rates.
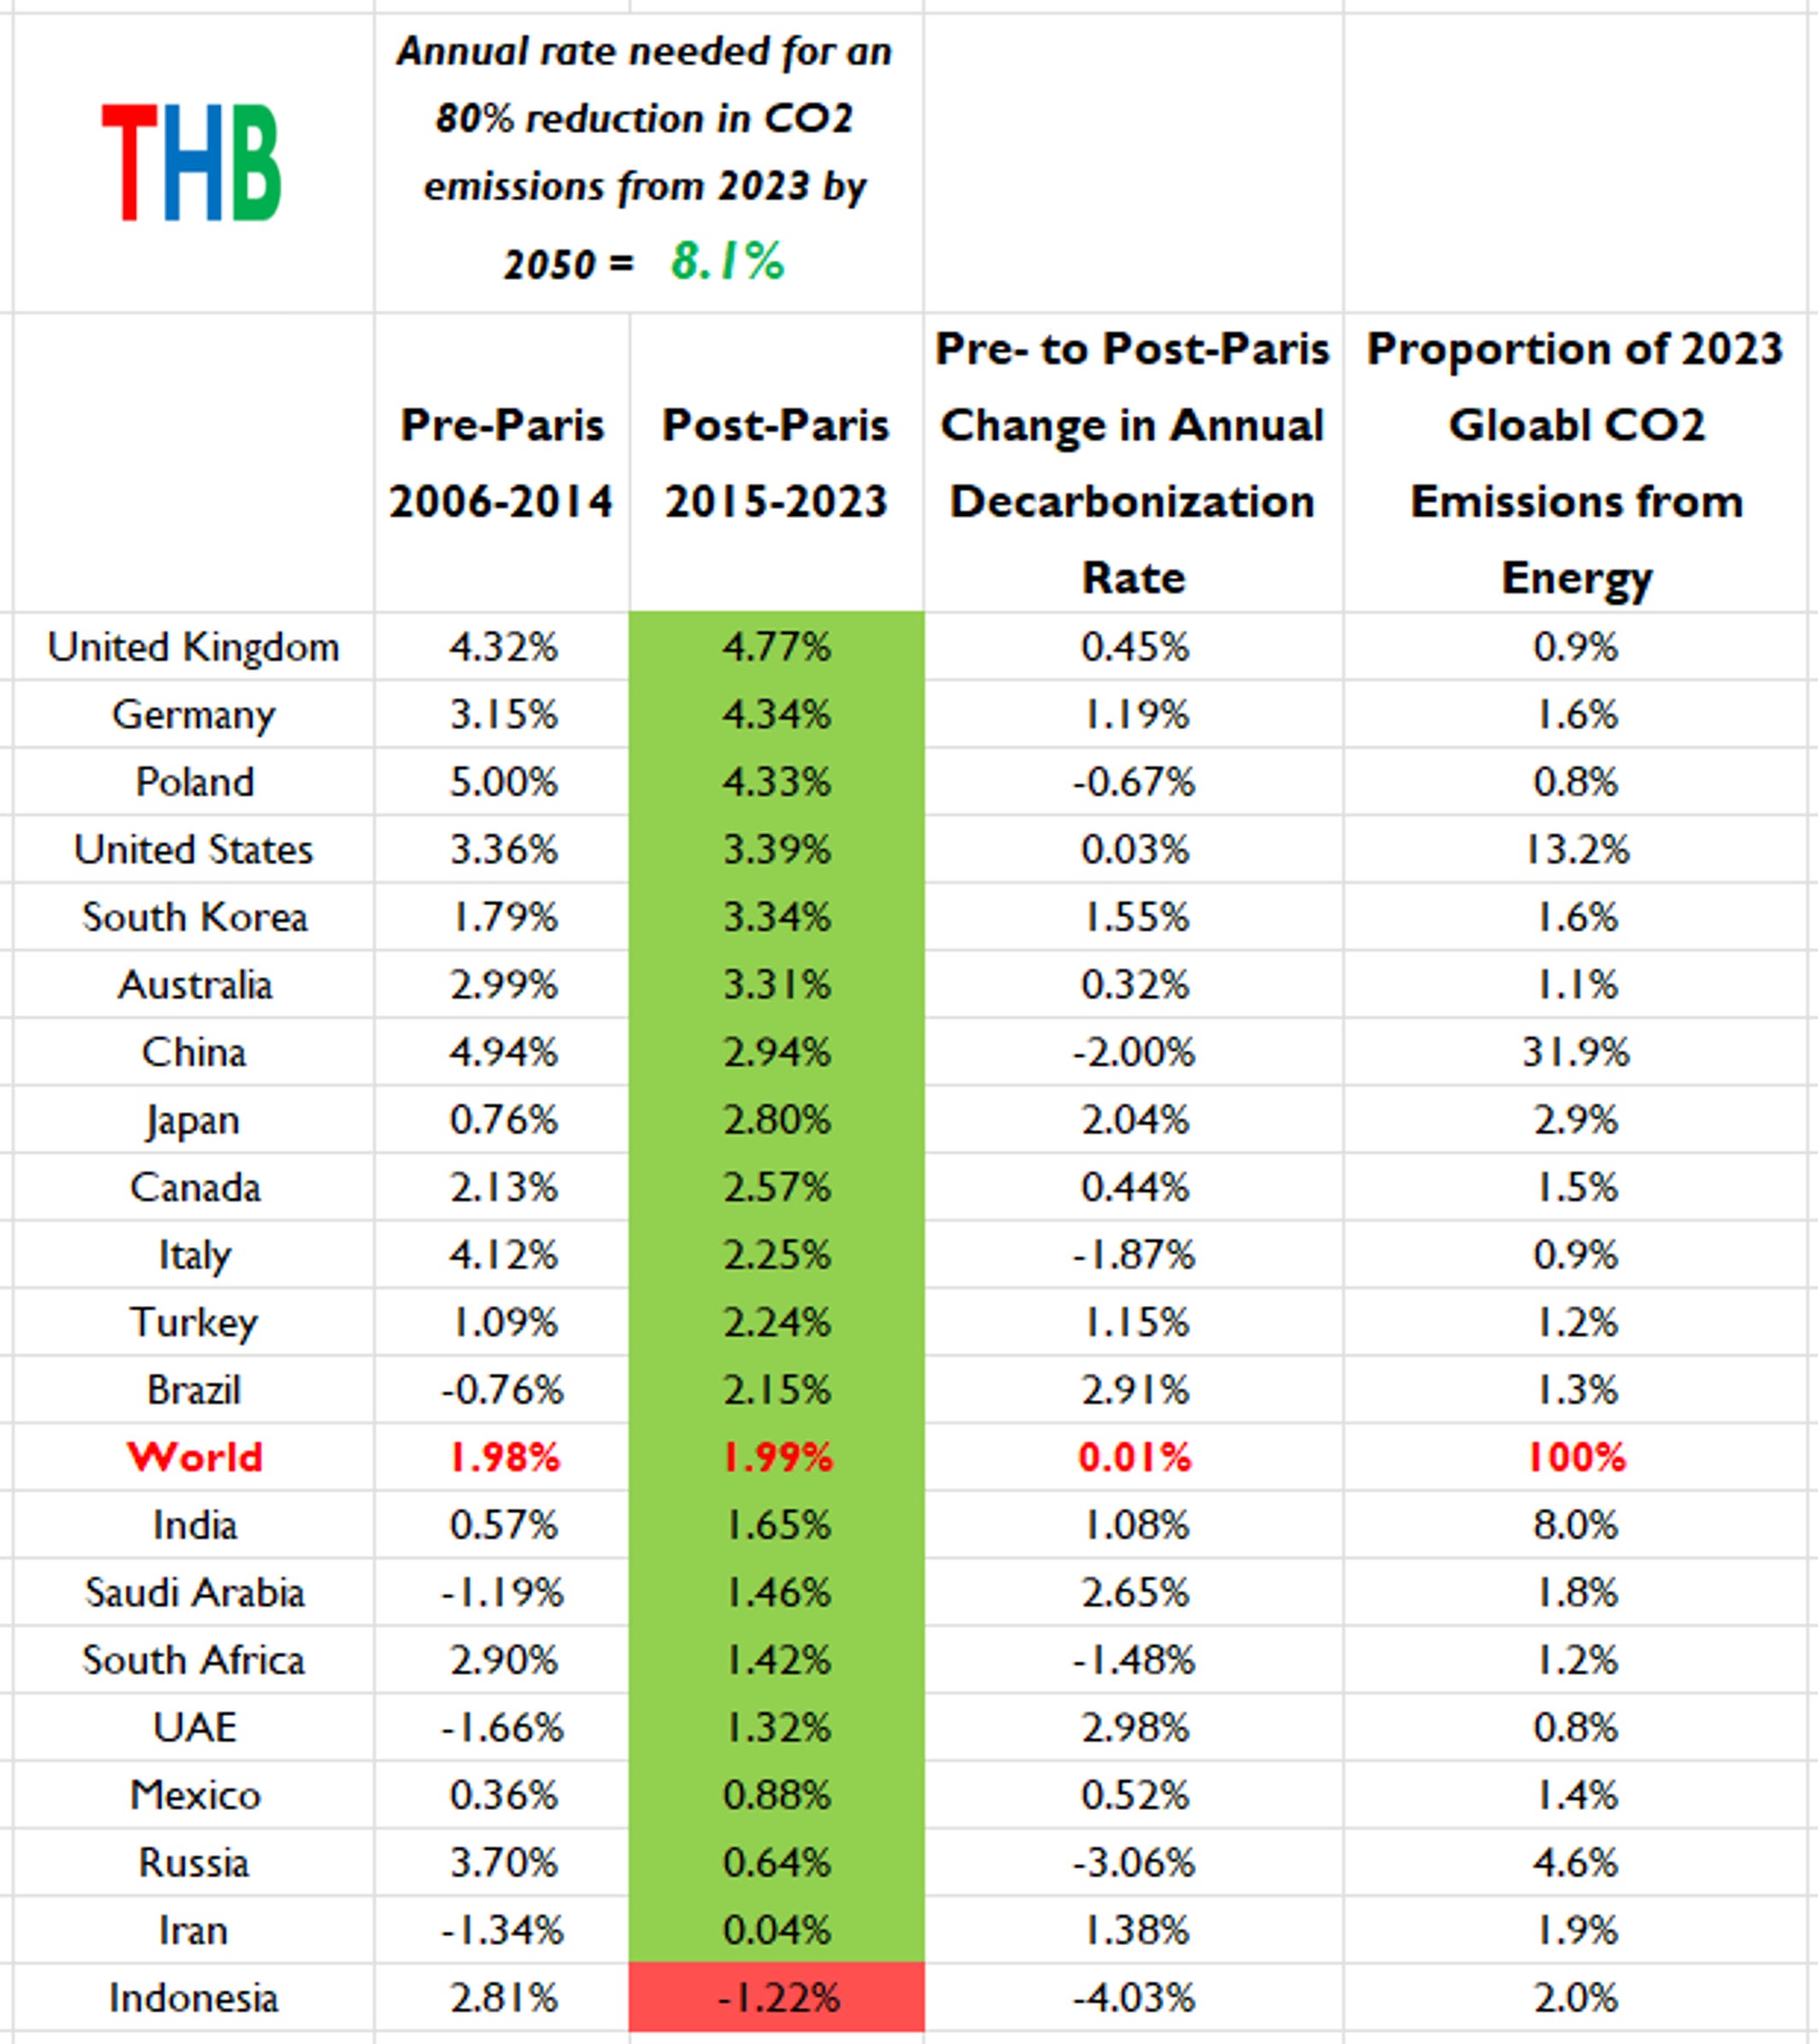
Some things to take from this analysis:
- There has been essentially no change in global decarbonization from the 8 years pre-Paris to the 8 years post-Paris;
- The world, at about a 2% rate of decarbonization, sits far off from the 8.1% implied by the Paris Agreement objectives, with almost a quarter of the time now from 2015 to 2050 now in the rearview mirror (8 of 35 years);
- No individual country among the top 20 emitters is anywhere close to the 8.1% annual rate of decarbonization implied by the Paris Agreement. Note that the 8.1% grows larger every year that the world does not meet the required decarbonization rate.
The table below presents the same data ranked by the annual rate of change in decarbonization rates from pre- to post-Paris.
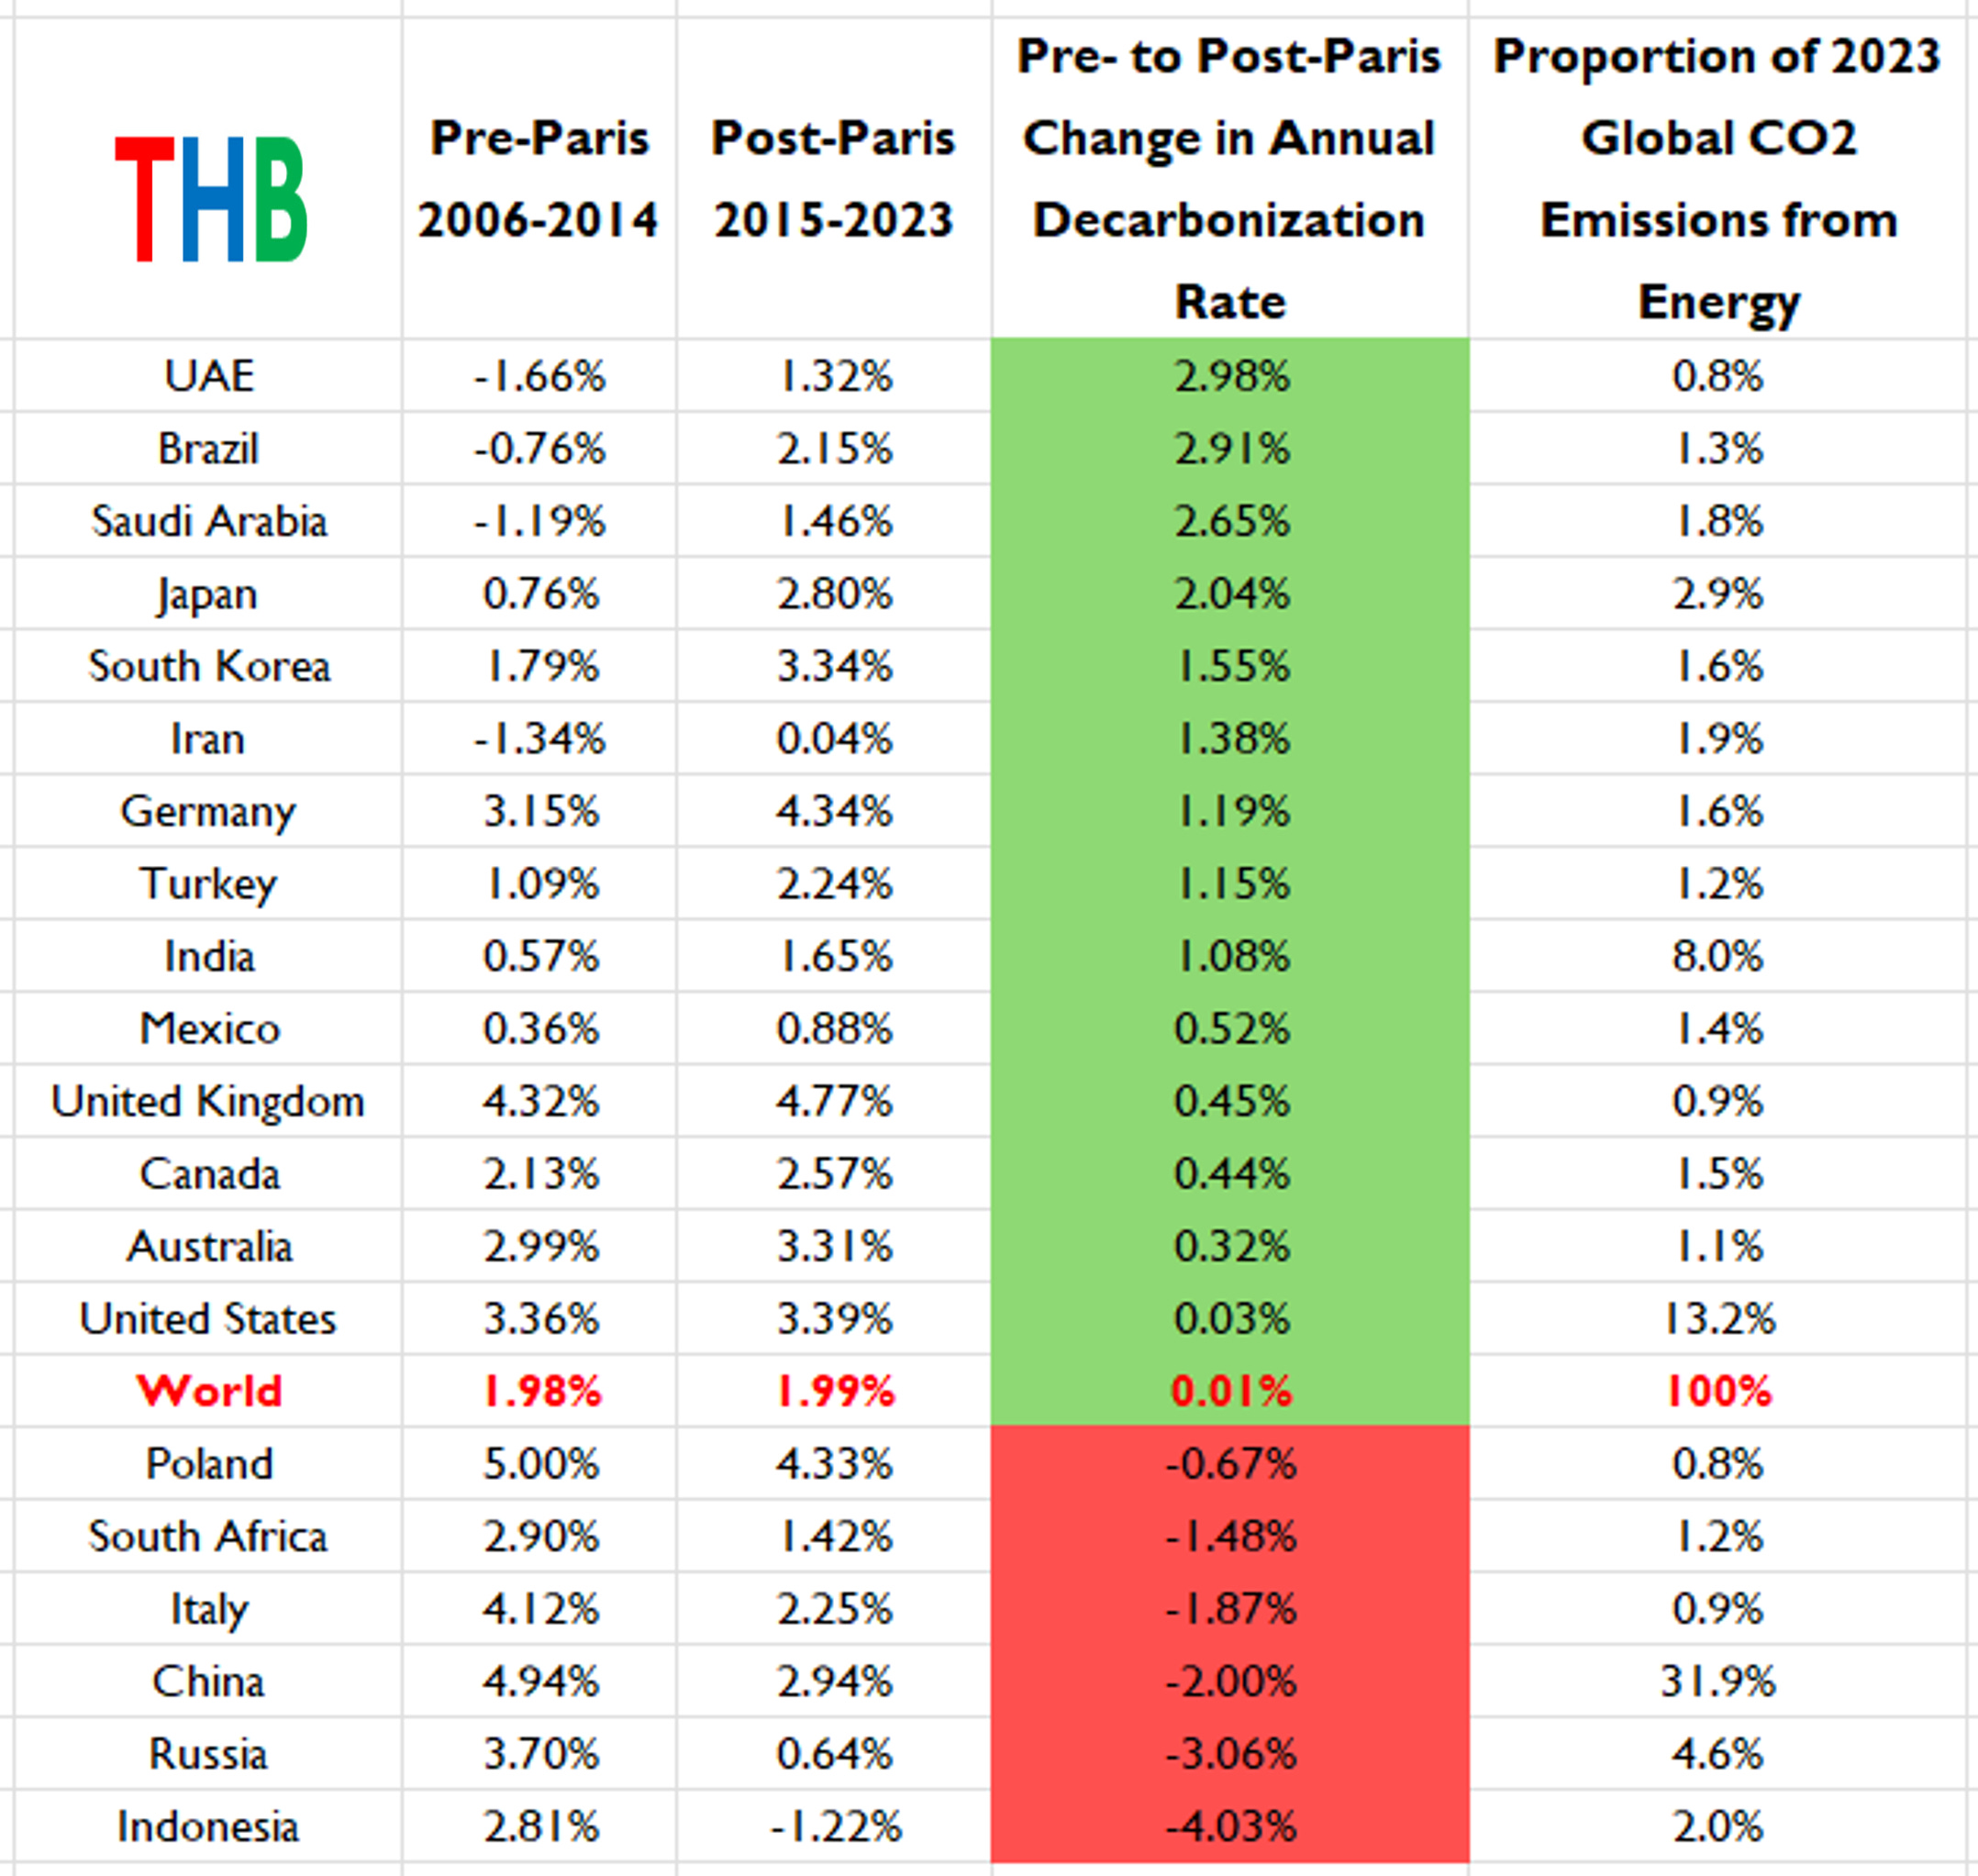
Some takeaways:
- Surprise! At the top of the table is UAE, which hosted the 2023 UNFCCC COP amid criticism due to its fossil fuel production (note that the US produces about 5x more oil than the UAE). However, none of the top-20 emitting countries improved their decarbonization rates more than the UAE in the 8 years after Paris.
- Fourteen (in green) of the top 20 emitting countries improved their rates of decarbonizing post-Paris, and six did not (in red).
- However, those 14 improvers accounted for 39.2% of global carbon dioxide emissions in 2023, and the 6 whose decarbonization rates slowed accounted for 41.4% of global emissions. This explains why the overall global decarbonization rate remained essentially unchanged. China in particular saw a large slowing in its decarbonization.
- The United States saw essentially no change, and was bested by not just the UAE but also Saudi Arabia and Iran.
- The only major emitters (>2% of global emissions) among the top 10 improvements in decarbonization rates are Japan and India.
Bottom line: At the global level, data on decarbonization from 2006 to 2023 shows no global effect of the Paris Agreement. At the individual country level, 14 countries show evidence of accelerated rates of decarbonization, but remain far off rates required to hit the Paris Agreement targets.
This analysis does not allow for an assessment of causation for changes in decarbonization rates in individual countries — future analyses here will seek to understand why decarbonization rates change over time and how much they can be influenced by policy.

This article was originally posted on Roger’s Substack, The Honest Broker. If you enjoyed this piece, please consider subscribing here.
1 If you are not familiar with my work on decarbonization, then this post will make a lot more sense if you start with this recent post which gives the background and simple math behind the concept of decarbonization: What Countries Have Decarbonized the Fastest? If you want an even deeper dive, please look at Chapters 3 and 4 of The Climate Fix.
2 GDP data used in this post are World Bank, GDP PPP (constant 2021 USD). Carbon dioxide emissions from energy comes from the 2024 Energy Institute Statistical Review of World Energy. Special thanks to Michael Pugh at AEI for data wrangling assistance.
The post We’ll Always Have Paris appeared first on American Enterprise Institute – AEI.